


 Jennifer Dawkins
Measurement should be baked into your marketing plan from the start – determining how you’ll measure the success of your activities is as important as identifying the activities themselves. We recommend creating a marketing scorecard that measures overall marketing health metrics, like Web sessions, organic traffic, and new contacts; as well as metrics tied to your specific marketing campaigns
For example, if you have a campaign to penetrate a new market, you could measure that by tracking qualified new contacts in that space. To be the most effective, your marketing scorecard should have specific targets and baselines to measure against.

While a marketing scorecard may not show you actual revenue generated from these efforts, they will show you which activities are working the best, which activities you can stop spending time on, and identify any problem areas in marketing that may be preventing you from achieving your goals.
Here are the key metrics to include on your marketing scorecard to help determine if you are focusing on the right activities and to ensure you are getting return on your marketing investment.
KPI Metrics to Track on your Marketing Scorecard
Web Performance Metrics
- Web sessions: 10-20% growth year over year
- Bounce rate: <60%
- Time on site: >2 minutes
Since your website is core to all of your marketing efforts, these key web metrics should be a staple on your scorecard and a good measure of the overall health of your marketing program. Maintaining a bounce rate at or below 60% indicates visitors coming to your site are finding what they are looking for. Session duration, or time on site, tells you how well your content is doing to keep them there. Aim to maintain average session duration of at least 2 minutes.

Example Scorecard
SEO Performance Metrics
- Organic traffic as a percentage of overall: >50%
- Domain and brand authority: incremental growth from where you are
- Identify and monitor your ranking of your most strategic keywords
Visitors who come to your site from organic search typically stay longer, engage more, and are more likely to become new contacts. Start from where you are, but aim to get to at least 50% and ideally 65% of your overall coming from organic search over time.
Other ways to measure your SEO efforts include monitoring how you are ranking for your top keywords and keeping an eye on your site’s domain authority. Domain authority is a score – on a scale of 1 to 100 – that Moz developed to predict how well your website will rank on search engine result pages. Moz has created a new value metric called brand authority (also on a scale of 1 to 100) to measure brand strength and prominence across the web.
Through your annual marketing planning process identify the keywords that are most impactful to your business and campaigns. Ensure that you have quality content around those keywords and that you monitor your rankings on a monthly basis.
Conversion through the funnel
To go a little deeper into what is moving the needle in terms of converting your web visitors to leads, leads to opportunities, and opportunity to sales, we recommend full-funnel reporting. Full funnel reporting tracks the total number of contacts at each lead stage and the conversion rate between each of these stages.
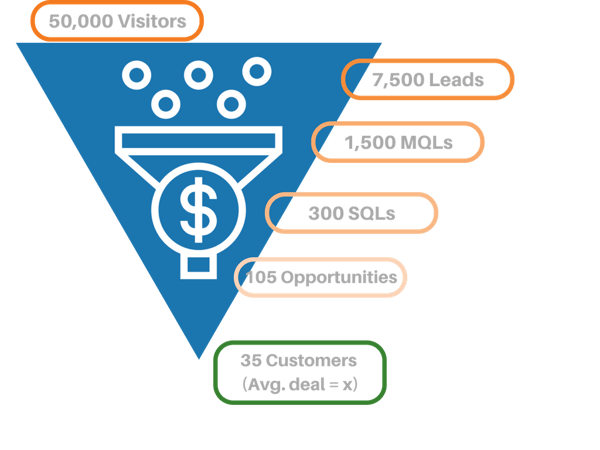
This process helps you visualize your entire marketing and sales cycle, see exactly where leads are converting or dropping off, and identify any problem areas along the way. And best of all, it helps attribute actual revenue to your marketing efforts. The better data you have for each of those contacts, such as their original source, content they’ve downloaded, and sales touch points along the way, the more you will know about what contributed to the sale at the end.
Accountability Metrics
Not all your metrics have to be numeric. If consistently creating content is an important goal for you, for example, it may be worth putting on the scorecard even if the success measure is just yes or no. This helps maintain accountability and highlights the connection between consistent execution to the plan and achieving each of your other marketing metrics.
Analyzing Your Metrics
Sometimes you’ll have something you didn’t expect greatly impacting your marketing metrics. Maybe a blog you wrote last year suddenly started ranking on search, bringing in a ton of new web visitors. Maybe another company has shared one of your content pieces on their social network or on their customer user forum and you’re suddenly getting lots of new contacts from referral traffic. Maybe a web update impacted how a group of pages are indexed on Google and suddenly a page that was doing great in search isn’t showing up anymore.
There are many things that can impact the effectiveness of your marketing efforts that may not be a specific line item on your scorecard so it’s important to keep a pulse on your Web analytics on a regular basis. If you see a spike or a dip, look into it to determine what is causing it. Noticing these anomalies quickly can help you fix issues before they have a lasting impact on your efforts. On the flip side, they can also alert you to opportunities to maximize your efforts. When you see traffic pouring in from an unexpected source, for example, you can quickly add a lead-generating CTA to that content piece in an effort to convert some of that traffic.
Frequency and Reporting
It’s not just what you measure that’s important. It’s how often you are measuring and who you are reporting those metrics to.
We recommend scanning your web analytics weekly for anomalies, tracking your marketing scorecard metrics monthly, and conducting full funnel reporting quarterly.
Each quarter, gather with sales, leadership, and other key stakeholders to discuss and analyze these metrics and make adjustments to your plan accordingly.
Want more?
For help determining the right mix of activities to achieve your desired results, read our B2B Marketing Growth Guide.

TREW is a marketing agency dedicated to reaching engineering and technical audiences through a range of marketing initiatives. Contact us today to learn more about the services we offer.
Jennifer Dawkins
 Jennifer has been successfully marketing to engineers and scientists for nearly 20 years. Her marketing experience spans from defining company narratives and developing integrated marketing campaigns to building mutually beneficial partner relationships and maximizing performance in cross-functional teams. Jennifer holds a Bachelor of Journalism degree from the University of Texas at Austin. She is a native Austinite and when not at work, enjoys being on the lake or cheering on her sons’ soccer teams.
About TREW Marketing
TREW Marketing is a strategy-first content marketing agency serving B2B companies that target highly technical buyers. With deep experience in the design, embedded, measurement and automation, and software industries, TREW Marketing provides branding, marketing strategy, content development, and digital marketing services to help customers efficiently and effectively achieve business goals.